Neuroscience

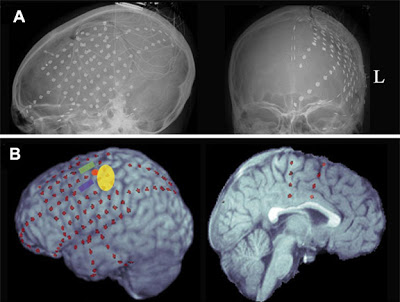
How do hemodynamic and electrophysiological1 measures of brain activity relate to each other? A cool new open access article in PNAS (He et al., 2008) reports on the similarities between spontaneous fluctuations in the BOLD (blood-oxygen-level-dependent) signal in fMRI and ultraslow brain waves recorded directly from the cortex of patients undergoing surgical monitoring for epilepsy. The figure below shows the subdural grid electrodes implanted over sensorimotor cortex in one patient (Fig. 1A), along with the somatotopic/somatomotor mapping of hand and face regions (Fig 1B).

Fig. 1 (He et al., 2008). Spatial topography of electrode coverage and sensorimotor network in Patient 1. (A) Radiograph showing electrode placements. (B) Three-dimensional rendering of anatomical MRI and projection of electrode locations onto the three-dimensional surface. Clinical mapping of the sensorimotor cortex is indicated by color patches. Red indicates hand motor area based on median nerve somatosensory evoked potential (SSEP); yellow indicates hand sensory area based on SSEP; blue indicates facial twitching in response to cortical stimulation; and green indicates hand grasp in response to cortical stimulation.
The signal fluctuations of interest are of the ultraslow variety, occurring over tens of seconds. As explained in the accompanying commentary (Balduzzi et al., 2008):

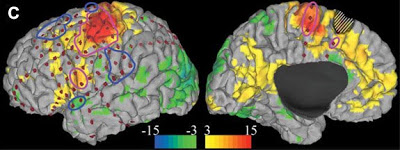
Fig. 1C (He et al., 2008). BOLD sensorimotor correlation map and electrode locations overlaid on the pial surface reconstructed from anatomical MRI. Four sensorimotor ROIs (delineated by magenta contours) and four control ROIs (blue contours) were determined in this patient. The cross-hatching indicates the epileptogenic zone that was subsequently resected.
Again (not surprisingly),

Fig. 2 (He et al., 2008). ROI-pair cross-correlations computed using BOLD signals. (B) Patient 1: BOLD lagged cross-correlation functions were averaged separately for SM-SM (red) and SM-C (blue) ROI pairs. (C) Combining data over all patients: peak ECoG cross-correlation values (within + 500 ms lag) as a function of ROI-pair type (SM-SM vs. SM-C) and arousal state (awake, SWS, and REM). Two-way ANOVA yielded a highly significant main effect of ROI-pair type. Neither the effect of arousal state nor the interaction of ROI-pair type x arousal state was significant.
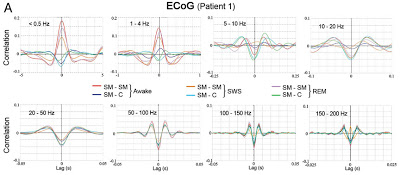
This effect in the electrocorticogram held whether the patients were awake, in SWS, or in REM sleep. Comparing the slowest two frequency bands in Fig. 2A below to the BOLD signal in Fig. 2B above, one can see the similarity between the correlation structures of the BOLD signal and the very slow ECoG activity. This was demonstrated quantitatively by a number of additional analyses shown in the main paper and in the supporting information.

Fig. 2 (He et al., 2008). ROI-pair cross-correlations computed using ECoG signals. (A) Patient 1: lagged cross-correlation functions were computed by using ECoG signal filtered in eight frequency bands for all possible SM-SM and SM-C ROI pairs. Red hues indicate SM-SM, and blue/green hues indicate SM-C.
What does it all mean? What is the role of all this slow "spontaneous" activity? We don't know yet.

Footnote
1 Specifically, recordings of local field potentials that comprise the electroencephalogram recorded from the scalp or the electrocorticogram recorded from the cortical surface.
References
Balduzzi D, Riedner BA, Tononi G. (2008). A BOLD window into brain waves. Proc Natl Acad Sci. 105:15641-2.
B. J. He, A. Z. Snyder, J. M. Zempel, M. D. Smyth, M. E. Raichle (2008). Electrophysiological correlates of the brain's intrinsic large-scale functional architecture. Proceedings of the National Academy of Sciences DOI: 10.1073/pnas.0807010105
Spontaneous fluctuations in the blood-oxygen-level-dependent (BOLD) signals demonstrate consistent temporal correlations within large-scale brain networks associated with different functions. The neurophysiological correlates of this phenomenon remain elusive. Here, we show in humans that the slow cortical potentials recorded by electrocorticography demonstrate a correlation structure similar to that of spontaneous BOLD fluctuations across wakefulness, slow-wave sleep, and rapid-eye-movement sleep. Gamma frequency power also showed a similar correlation structure but only during wakefulness and rapid-eye-movement sleep. Our results provide an important bridge between the large-scale brain networks readily revealed by spontaneous BOLD signals and their underlying neurophysiology.
- The Electroencephalographer's Couch
BRAIN WAVE SOFA, by lucas maassen The Brain Wave Sofa is a representation of a 3 second wave of Alpha brain activity captured with a 3d EEG. It shows the 3 seconds when the eyes closed. From the 3d-EEG the file got directly milled in faom by a 3d milling...
- Dialogues And Dilbert On Prediction Errors
A new article in TICS (Trends in Cognitive Sciences) by Niv and Schoenbaum makes use of Dilbert cartoons and a Q&A format to discuss the neural correlates of prediction error signals: The goal of this ‘dialogue style’ review (which loosely follows...
- Bottoms Up
Attention (everyone knows what that1 is) is often described as having "bottom-up" and "top-down" components (referring to the direction of information flow from sensory to high-order cortical regions, and vice versa). ThinkGeek (bottoms up!) In a recent...
- Lose Yourself
You better lose yourself in the music, the moment You own it, you better never let it go You only get one shot, do not miss your chance to blow This opportunity comes once in a lifetime yo --Eminem, Lose Yourself When the Brain Loses Its Self: Prefrontal...
- Guest Lecturer On Network Communication In Behavior And Disease!
Dr. Adrian Guggisberg University Hospital Geneva, Switzerland Guest Lecturer: Network communication in behavior and disease Wednesday, September 5 12:00 pm-1:30 pm BPS 1142 Abstract: The brain is a network of massively interconnected processing elements....
Neuroscience
Correlations between Slow Cortical Potentials and Spontaneous Fluctuations of the BOLD Signal

How do hemodynamic and electrophysiological1 measures of brain activity relate to each other? A cool new open access article in PNAS (He et al., 2008) reports on the similarities between spontaneous fluctuations in the BOLD (blood-oxygen-level-dependent) signal in fMRI and ultraslow brain waves recorded directly from the cortex of patients undergoing surgical monitoring for epilepsy. The figure below shows the subdural grid electrodes implanted over sensorimotor cortex in one patient (Fig. 1A), along with the somatotopic/somatomotor mapping of hand and face regions (Fig 1B).

Fig. 1 (He et al., 2008). Spatial topography of electrode coverage and sensorimotor network in Patient 1. (A) Radiograph showing electrode placements. (B) Three-dimensional rendering of anatomical MRI and projection of electrode locations onto the three-dimensional surface. Clinical mapping of the sensorimotor cortex is indicated by color patches. Red indicates hand motor area based on median nerve somatosensory evoked potential (SSEP); yellow indicates hand sensory area based on SSEP; blue indicates facial twitching in response to cortical stimulation; and green indicates hand grasp in response to cortical stimulation.
The signal fluctuations of interest are of the ultraslow variety, occurring over tens of seconds. As explained in the accompanying commentary (Balduzzi et al., 2008):
These [EEG] fluctuations can be very slow (infraslow oscillations, less than 0.1 Hz; slow oscillations, less than 1 Hz; and slow waves or delta waves, 1–4 Hz), intermediate (theta, 4–8 Hz; alpha, 8–12 Hz; and beta, 13–20 Hz), and fast (gamma, greater than 30 Hz). Moreover, slower fluctuations appear to group and modulate faster ones. The BOLD signal underlying functional magnetic resonance imaging (fMRI) also exhibits spontaneous fluctuations at the timescale of tens of seconds (infraslow, less than 0.1 Hz) which occurs at all times, during task-performance as well as during quiet wakefulness, rapid eye movement (REM) sleep, and non-REM sleep (NREM).If these infraslow BOLD fluctuations occur all the time, across different behavioral states, what is their significance? What sort of information are they conveying? Turns out that no one knows yet. It isn't even discussed by He et al. So let's turn to the Balduzzi et al. commentary again:
Although infraslow fluctuations are a prominent, constant feature of both BOLD and EEG signals, we still do not know where they originate. One possibility is that they reflect diffuse input from a subcortical source that is fluctuating in the infraslow range. For example, the firing of neurons in the midbrain reticular formation waxes and wanes with a period of ~10 sec during both wakefulness and sleep. Alternatively, neurons may slowly modulate their level of activity because of intrinsic changes in excitability, in the activity of ionic pumps, of neurotransmitter transporters, and of glial cells. Last, modeling the overall organization of corticocortical connectivity suggests that infraslow, system-level fluctuations in activity may be an emergent network property, not reducible to properties of individual neurons.Nevertheless, one [somewhat obvious] principle is the inverted Hebbian dictum, "what wires together, fires together."
...both BOLD and ECoG fluctuations display a pattern of regional correlations, or functional connectivity, which closely reflects those regions’ anatomical connectivity.We see an anatomical example of that in the figure below, which illustrates the sensorimotor correlation map in one of the patients.

Fig. 1C (He et al., 2008). BOLD sensorimotor correlation map and electrode locations overlaid on the pial surface reconstructed from anatomical MRI. Four sensorimotor ROIs (delineated by magenta contours) and four control ROIs (blue contours) were determined in this patient. The cross-hatching indicates the epileptogenic zone that was subsequently resected.
Again (not surprisingly),
BOLD correlations between sensorimotor ROIs should be, by definition, higher than correlations between a sensorimotor ROI [region of interest] and a control ROI (see Fig 2B below). The question was whether some type of electrophysiological activity may similarly differentiate sensorimotor-sensorimotor from sensorimotor-control correlations. To pursue this question, ECoG signals filtered in eight different frequency bands were used to compute the lagged correlation functions...ECoG activity in the two slowest frequency bands (less than 0.5-Hz and 1–4-Hz bands) distinguished sensorimotor-sensorimotor from sensorimotor-control ROI pairs: the sensorimotor-sensorimotor ROI pairs were positively correlated, whereas the sensorimotor-control ROI pairs were negatively or not correlated (Fig 2C).

Fig. 2 (He et al., 2008). ROI-pair cross-correlations computed using BOLD signals. (B) Patient 1: BOLD lagged cross-correlation functions were averaged separately for SM-SM (red) and SM-C (blue) ROI pairs. (C) Combining data over all patients: peak ECoG cross-correlation values (within + 500 ms lag) as a function of ROI-pair type (SM-SM vs. SM-C) and arousal state (awake, SWS, and REM). Two-way ANOVA yielded a highly significant main effect of ROI-pair type. Neither the effect of arousal state nor the interaction of ROI-pair type x arousal state was significant.
This effect in the electrocorticogram held whether the patients were awake, in SWS, or in REM sleep. Comparing the slowest two frequency bands in Fig. 2A below to the BOLD signal in Fig. 2B above, one can see the similarity between the correlation structures of the BOLD signal and the very slow ECoG activity. This was demonstrated quantitatively by a number of additional analyses shown in the main paper and in the supporting information.

Fig. 2 (He et al., 2008). ROI-pair cross-correlations computed using ECoG signals. (A) Patient 1: lagged cross-correlation functions were computed by using ECoG signal filtered in eight frequency bands for all possible SM-SM and SM-C ROI pairs. Red hues indicate SM-SM, and blue/green hues indicate SM-C.
What does it all mean? What is the role of all this slow "spontaneous" activity? We don't know yet.
...spontaneous slow cortical potentials (SCP) and the correlated BOLD signal fluctuations likely reflect endogenous fluctuations of cortical excitability within functional systems.OK, that's pretty vague, so the authors also suggest that
...spontaneous fMRI BOLD signals and SCPs both reflect a fundamental stratum of the brain’s intrinsic organization that transcends levels of consciousness.Well then. Not exactly settled yet, is it? I'll let Balduzzi et al. offer this final speculation (and metaphor):
...spontaneous activity may be important for the brain’s trillions of synapses, perhaps by keeping them exercised or consolidating and renormalizing their strength. Another notion is that spontaneous activity may be necessary to maintain a fluid state of readiness that allows the cortex to rapidly enter any of a number of available states or firing patterns—a kind of metastability. Theoretical work suggests that the repertoire of available states is maximal under moderate spontaneous activity, and shrinks dramatically with either complete inactivity or hyperactivity. But what kind of neural states? One possibility is that the cortex is like a sea undulating gently, and that evoked or task-related responses would be like small ripples on its surface. This possibility is consistent with fMRI studies, because spontaneous slow fluctuations in BOLD are as large or larger than those evoked by stimuli.

Footnote
1 Specifically, recordings of local field potentials that comprise the electroencephalogram recorded from the scalp or the electrocorticogram recorded from the cortical surface.
References
Balduzzi D, Riedner BA, Tononi G. (2008). A BOLD window into brain waves. Proc Natl Acad Sci. 105:15641-2.
B. J. He, A. Z. Snyder, J. M. Zempel, M. D. Smyth, M. E. Raichle (2008). Electrophysiological correlates of the brain's intrinsic large-scale functional architecture. Proceedings of the National Academy of Sciences DOI: 10.1073/pnas.0807010105
Spontaneous fluctuations in the blood-oxygen-level-dependent (BOLD) signals demonstrate consistent temporal correlations within large-scale brain networks associated with different functions. The neurophysiological correlates of this phenomenon remain elusive. Here, we show in humans that the slow cortical potentials recorded by electrocorticography demonstrate a correlation structure similar to that of spontaneous BOLD fluctuations across wakefulness, slow-wave sleep, and rapid-eye-movement sleep. Gamma frequency power also showed a similar correlation structure but only during wakefulness and rapid-eye-movement sleep. Our results provide an important bridge between the large-scale brain networks readily revealed by spontaneous BOLD signals and their underlying neurophysiology.
- The Electroencephalographer's Couch
BRAIN WAVE SOFA, by lucas maassen The Brain Wave Sofa is a representation of a 3 second wave of Alpha brain activity captured with a 3d EEG. It shows the 3 seconds when the eyes closed. From the 3d-EEG the file got directly milled in faom by a 3d milling...
- Dialogues And Dilbert On Prediction Errors
A new article in TICS (Trends in Cognitive Sciences) by Niv and Schoenbaum makes use of Dilbert cartoons and a Q&A format to discuss the neural correlates of prediction error signals: The goal of this ‘dialogue style’ review (which loosely follows...
- Bottoms Up
Attention (everyone knows what that1 is) is often described as having "bottom-up" and "top-down" components (referring to the direction of information flow from sensory to high-order cortical regions, and vice versa). ThinkGeek (bottoms up!) In a recent...
- Lose Yourself
You better lose yourself in the music, the moment You own it, you better never let it go You only get one shot, do not miss your chance to blow This opportunity comes once in a lifetime yo --Eminem, Lose Yourself When the Brain Loses Its Self: Prefrontal...
- Guest Lecturer On Network Communication In Behavior And Disease!
Dr. Adrian Guggisberg University Hospital Geneva, Switzerland Guest Lecturer: Network communication in behavior and disease Wednesday, September 5 12:00 pm-1:30 pm BPS 1142 Abstract: The brain is a network of massively interconnected processing elements....
