Voodoo Gurus

Marie Laveau's House of Voodoo [by OZinOH]
Does anyone else miss having the Society for Neuroscience conference in New Orleans as much as I do? The 2003 meeting was great fun, but there seems to be no plan to return any time soon. The 2009 SFN meeting was supposed to be in New Orleans, but it will be held in Chicago instead. Other large conferences have returned to the Ernest N. Morial Convention Center, most notably the American Heart Association in November 2008, with 30,000 attendees.
On another nostalgic note, this blog turns 3 today. To mark the occasion, we'll take a peek back into The Neurocritic's archives, because what's old is new again.
New Voodoo Correlations: Now Taking Nominations!
By now, most neuroimagers and cognitive neuroscientists have heard about the controversial (some would say inflammatory) new paper by Ed Vul and colleagues on Voodoo Correlations in Social Neuroscience (PDF), summarized in this post.1 In the article, Vul et al. claimed that over half of the fMRI studies that were surveyed used faulty statistical techniques to analyze their data:
...using a strategy that computes separate correlations for individual voxels, and reports means of just the subset of voxels exceeding chosen thresholds. We show how this non-independent analysis grossly inflates correlations, while yielding reassuring-looking scattergrams. This analysis technique was used to obtain the vast majority of the implausibly high correlations in our survey sample.Needless to say, authors of the criticized papers were not pleased, and some have posted rebuttals (Jabbi et al. in preparation, PDF). Vul and colleagues responded to that rebuttal, but a new invited reply by Lieberman et al. (submitted, PDF) has just popped up. Here are some highlights from the abstract:
...Vul et al. incorrectly claim that whole-brain regression analyses use an invalid and “non-independent” two-step inferential procedure. We explain how whole-brain regressions are a valid single-step method of identifying brain regions that have reliable correlations with individual difference measures. ... Finally, it is troubling that almost 25% of the “non-independent” correlations in the papers reviewed by Vul et al. were omitted from their own meta-analysis without explanation.An independent observer (Dr Justin Marley at The Amazing World of Psychiatry) made a point related to the latter one in his critique of Vul et al.:
Vul et al. are fully capable of responding to these objections, and I'm sure we'll see a rebuttal from them shortly. What I would like to do here is to mention 6 previous posts from The Neurocritic's archives (which all happen to cover the field of social neuroscience):1. The methodology is opaque - in particular the method of identifying relevant papers. The authors have criticised a number of the imaging studies similarly.
2. In my opinion there is possibly a selection bias in this paper - a small number of all possible papers are selected but due to the opacity of the methodology section we are unable to ascertain the nature of a possible selection bias. The authors criticise other researchers for identifying voxel activity based on correlation with the behaviour/phenomenological experience in question i.e. selection bias.
3. If there is a selection bias then the authors would have selected those papers which support their argument - thus generating a result similar to the ‘non-independent error’. Furthermore they have produced ‘visually appealing’ graphs for their data which ‘provide reassurance’ to the ‘viewer that s/he is looking at a result that is solid’.
Mental as Anything"The Disturbing World of Implicit Bias..."The Trust GameMentalizing MentalizingBorderline … feels like I'm goin' to lose my mindWho Can You Trust?
Although these posts don't engage in a rigorous deconstruction of analytic techniques à la Vul et al., they do ask some questions about the methods and about how the results are framed (i.e., over-interpreted). But first, let's reiterate that
The critics among us are not trying to trash the entire field of social neuroscience (or neuroimaging in general). Some of us are taking concrete steps to open a dialogue and improve its methodology, while others are trying to rein in runaway interpretations.The rebuttals to Vul et al. emphasize that the latter's analytic objections are by no means unique to social neuroscience. Vul et al. acknowledged this, albeit not in a prominent way. The criticized authors are also peeved that "the media" (mostly bloggers) have contributed to a "sensationalized" atmosphere before the paper has been published. However, as previously noted in Mind Hacks,
The paper was accepted by a peer-reviewed journal before it was released to the public. The idea that something actually has to appear in print before anyone is allowed to discuss it seems to be a little outdated (in fact, was this ever the case?).Why do I have a problem with some papers in social neuroscience? Let's take the study by Mitchell et al. (2006), which qualified for its own special category in the Vul et al. critique:
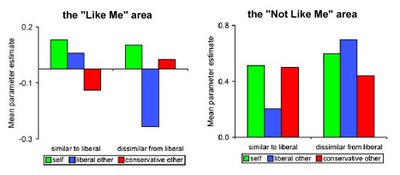
* study 26 carried out a slightly different, non-independent analysis: instead of explicitly selecting for a correlation between IAT and activation, they split the data into two groups, those with high IAT scores and those with low IAT scores, they then found voxels that showed a main effect between these two groups, and then computed a correlation within those voxels. This procedure is also non-independent, and will inflate correlations.)The participants in that study made judgments about hypothetical people who were either similar or dissimilar to themselves (on liberal vs. conservative sociopolitical views). Two regions of medial prefrontal cortex were identified: ventral mPFC was the "Like Me" area and dorsal mPFC was the "Not Like Me" area. Even if we believe those inferences about mentalizing, how are we to interpret these graphs?

Does the first bar graph (left) mean that liberals are a little less hostile to conservatives than vice versa? Does the other bar graph (right) mean that the “Not Like Me” area in liberals is equally activated by “self” and “conservative other”?? What DOES it all mean?After the scanning session was over, the participants...
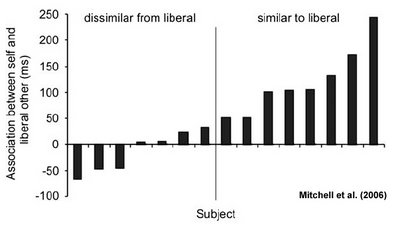
...completed a "liberal-conservative" IAT [Implicit Association Test]2 that used photos of the hypothetical persons presented for "mentalizing" judgments in the scanning session.

The authors used the IAT to retroactively assign subjects to "like liberal" and "not like liberal" groups. As the graph illustrates, only 3 subjects (out of 15 total) actually had RT effects indicating they might have a closer affinity to the conservative "other" (if you believe the IAT).Very well then. The researchers should have recruited actual conservative Christians for a valid sample of conservative students.
But the Voodoo Guru Award goes to...

...King-Casas et al. (Science 2008) for The Rupture and Repair of Cooperation in Borderline Personality Disorder!!
This paper examined how well individuals with borderline personality disorder (BPD) trusted others in an economic exchange game (called, conveniently enough, the Trust Game). In this game, one player (the Investor) gives a sum of money to the other player (the Trustee). The investment triples, and the Trustee decides how much to give back to the Investor. Relative to the control group, the BPD group was more likely to make a small repayment after receiving a small investment. This reflected a lack of cooperation (or "coaxing" behavior) designed to induce the Investors to trust their partners.
Borderline … feels like I'm goin' to lose my mind
So why do I feel like I'm goin' to lose my mind?3 As suggested by a colleague, the present paper 1) makes liberal use of reverse inference and 2) reeks of fishing.4 In my view, the real trouble arises when the authors try to explain what bits of the brain might be implicated in the lack of trust shown by players with BPD. It's the insula! [and only the insula]. Why is that problematic? We shall return to that question in a moment.Who Can You Trust?
In the study of Sanfey et al., unfair offers were associated with greater activity in bilateral anterior insula, dorsolateral prefrontal cortex, and anterior cingulate cortex, with the degree of insular activity related to the stinginess of the offer. A similar relationship was observed here in the controls, but not in the BPD patients. Taking a step back for a moment, we see differences between control and BPD participants (for the contrast low vs. high investment) in quite a number of places...
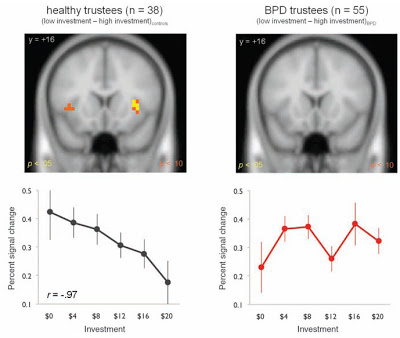
However, the within-group analysis in controls yielded a "small investment" effect only in bilateral anterior insula (12 voxels and 15 voxels, respectively, at p<.10). The same analysis in the BPD group yielded absolutely no significant differences anywhere in the brain! BPD participants react to small stingy investments with differential behavior (by returning a very low percentage of the investment), yet there is no area in the brain telling them to do this. Perhaps something is going on in the delay period between the investment and repayment phases, but if so we don't find out. The authors' interpretation of the null brain effect is that BPD subjects have a social perception problem (as Montague explains here), and do not respond correctly to social norm violations.
[Thus], the authors bypassed more general analyses comparing BPD and control brains during the point of investment and the point of repayment. Instead, the major neuroimaging result contrasted the receipt of low investment offers vs. high investment offers, as illustrated below. Control brains showed a nearly perfect linear correlation [r=-.97] between $ offer and activity in the anterior insula (expressed here as a negative correlation, because low $ offers correlated with high insula activity). Such a relationship was not observed in BPD brains...

Fig. 3 (King-Casas et al., 2008). Response of 38 healthy trustee brains and 55 BPD trustee brains to level of cooperation.
In yet another case of reverse inference, the authors concluded that:
Neurally, activity in the anterior insula, a region known to respond to norm violations across affective, interoceptive, economic, and social dimensions, strongly differentiated healthy participants from individuals with BPD.However, many other imaging studies have shown that this exact same region of the insula is activated during tasks that assess speech, language, explicit memory, working memory, reasoning, pain, and listening to emotional music (see this figure).
Voodoo or no voodoo?
What do you think?
Footnotes
1 You can also read a quick overview here and more in-depth commentary here.
2 We'll gloss over the objections of some commenters who think the IAT itself is voodoo.
3 Other than the fact that I am not knowledgeable in behavioral game theory (see Camerer et al., 2003 for that, PDF).
4 They also reported significance (corrected using FDR procedures) at the p<.1 level. Why? This paper on Detecting signals in FMRI data using powerful FDR procedures (Pavlicova et al., 2008) recommends the standard α level (= .01 or .05).
References
Jabbi M, Keysers C, Singer T, Stephan KE. (in preparation). Rebuttal of "Voodoo Correlations in Social Neuroscience" by Vul et al. – summary information for the press (PDF).
King-Casas B, Sharp C, Lomax-Bream L, Lohrenz T, Fonagy P, Montague PR. (2008). The Rupture and Repair of Cooperation in Borderline Personality Disorder. Science 321:806-810.
Lieberman MD, Berkman ET, Wager TD. (submitted). Correlations in social neuroscience aren't voodoo: A reply to Vul et al. Invited reply submitted to Perspectives on Psychological Science (PDF).
Mitchell, J.P., Macrae, C.N., and Banaji, M.R. (2006). Dissociable Medial Prefrontal Contributions to Judgments of Similar and Dissimilar Others. Neuron 50: 655–663.
Vul E, Harris C, Winkielman P, Pashler H (2009). Voodoo Correlations in Social Neuroscience. Perspectives on Psychological Science, in press (PDF).

- The Paper Formerly Known As "voodoo Correlations In Social Neuroscience"
Voodoo no more! The paper everyone loves (or loves to hate) has a new name.1 Through a number of channels [The Chronicle of Higher Education via @vaughanbell, Ed Vul's website, and Neuroskeptic], The Neurocritic has learned that the "Voodoo Correlations"...
- Voodoo Counter-counterpoint
In today's Weekday Update, The Neurocritic is pleased to present an excerpt from Vul et al.'s rebuttal to Jabbi et al.'s rebuttal to the lively and controversial paper by Vul, Harris, Winkielman, and Pashler (PDF). The intro, main bullet...
- Voodoo Correlations In Social Neuroscience
The end of 2008 brought us the tabloid headline, Scan Scandal Hits Social Neuroscience. As initially reported by Mind Hacks, a new "bombshell of a paper" (Vul et al., 2009) questioned the implausibly high correlations observed in some fMRI studies...
- Who Can You Trust?
As a sequel to the "Trust Your Insula" theme from last time (i.e., Borderline … feels like I'm goin' to lose my mind), The Neurocritic has consulted the BrainMap database, which revealed that the anterior insula is activated in a wide variety...
- Borderline … Feels Like I'm Goin' To Lose My Mind
No, the 80s Madonna song isn't really about Borderline Personality Disorder. But a new study in Science (King-Casas et al., 2008) makes me feel like I'm goin' to lose my mind. Or more precisely, makes me exhibit two of nine DSM-IV-TR criteria:...
